Forex Technical Analysis
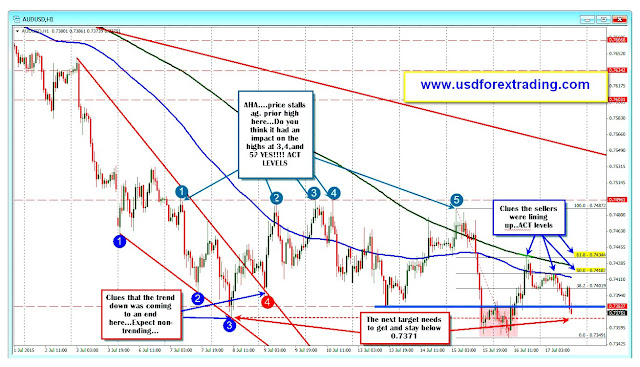
Technical Analysis is an approach to analyzing the pattern of price movements in the past to estimate price movements in the future. In this case, of course the analyst must have a price chart / chart.
Please note that at this time there are a lot of traders who are very skilled at mastering technical analysis, even many of them are able to make even modify technical indicators.
You need to understand that the main component of the formation of price movements consists of 5 components, namely: opening price (Open), highest price (High), lowest price (Close), and transaction volume (V), if abbreviated, it is called OHLCV.
From the OHLCV data it is then used mathematical and statistical methods to then create indicators in modern analysis techniques.
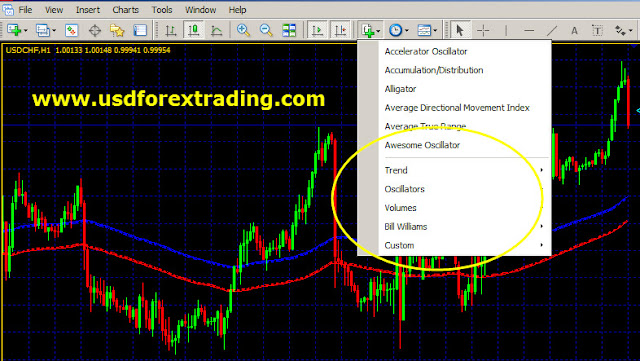
In general the indicators of the Modern Technical Analysis are divided into:
1. Momentum Indicator
which includes this category are indicators such as Stochastic, William% R, RSI etc.,
2. Volatility Indicator
an example of an indicator that serves to determine the level of price volatility, namely: Bollinger Band, Keltner Band etc.
3. Volume indicators
generally included in this category are OBV (On Balance Volume), OSCV (Volume Oscillator) etc.
4. Trend Following Indicators
General indicators that fall into this category are like Moving Average, MACD, Parabolic SAR etc.
The number of indicators in modern technical analysis amounts to hundreds, not to mention added creations - the creation of the world's top traders who make newer indicators and techniques. As for each category of indicators above each has different characteristics, but there is only one characteristic that is certain and will never change, namely: price movements are always faster than any indicator.
The use of technical indicators can be adjusted with the trading style profile and the frequency of your trading. The shorter the timeframe you use, the movement of the indicator will be the higher the volatility. It is recommended that you understand the use of these indicators correctly.
An example that is often mistaken in using indicators is on MACD. Often people only use 1 MACD in analyzing charts, even though Gerald Appel in his book suggests using two MACDs with different time frames to analyze price movement patterns.
In addition to the above, Support Resistance is also a major component of an analyst. Usually at this Support Resistance level, a trader will take a buy / sell decision for an instrument and at the same time become a target for estimating the direction of price movements to be achieved.
In instruments that move uptrend, the price movement will tend to break out through the resistance and create a new resistance level, on the contrary on instruments that are downtrend, prices will tend to penetrate support to create a new support level. This is also often used as a reference by traders or analysts to analyze in order to take trading decisions.
What is explained above is just a general explanation of Technical Analysis. Beginner traders who are just learning technical analysis are usually when they just understand and understand an indicator, then they will immediately try it on real trading, and when it turns out to generate profits usually the trader will overconfidence and feel confident that it is the best indicator for him. . And when it turned out it was time for trading and loss because it turned out that the price suddenly dropped faster than the indicator, then did not have time to cut, began to arise uncertainty over the indicator and began to study again looking for new indicators. This will continue to happen repeatedly. As a result of the frequent occurrence of this case wherein the theory arises: that we cannot predict the direction of price movements.
But we can anticipate it when implementing a good and correct trading plan and money management.
Because the main factor for successful trading is basically the money management and trading plan itself.


0 Comments